Memory debugging is a crucial task for identifying and resolving issues in software, especially when it comes to those elusive and often cryptic memory-related problems. One of the most powerful and versatile tools for memory debugging on Windows is the Windows Debugger, commonly known as WinDBG. In this guide, we will walk you through the installation process with step-by-step instructions along with how to start digging into the dump file.
Locating The Memory Dump File
Your Windows computer or server just Blue Screened on you and gave you a super generic error saying:
Your PC ran into a problem and needs to restart. We’re just collecting some error info, and then we’ll restart for you.”
-Microsoft
This error tells you nothing and it can definitely be frustrating because you just want to know why your machine blue screened. When the blue screen happens, Windows writes a dump file to ‘C:\Windows\Minidump’. This dump file can then be loaded into a Memory Debugger tool, such as WinDGB, to analyze what occurred when your machine crashed.
Download WinDGB
The first step is to download the WinDBG tool from the official Microsoft website. You can find the WinDBG download here. Make sure to select the appropriate version for your Windows operating system.

WinDGB will launch after the install completes and from there you can start going through your memory dump file.
Analyzing The Dump File
To start, you need to load the dump file into WinDBG. Click File > Start Debugging > Open Dump File and chose the location of your dump file.

This will load the base information into the window. Here you will be able to see when the event occurred and some system information. There is not much information as far as what happened… Yet. In the command window (where it says 2: kd>), type ‘!analyze -v’.

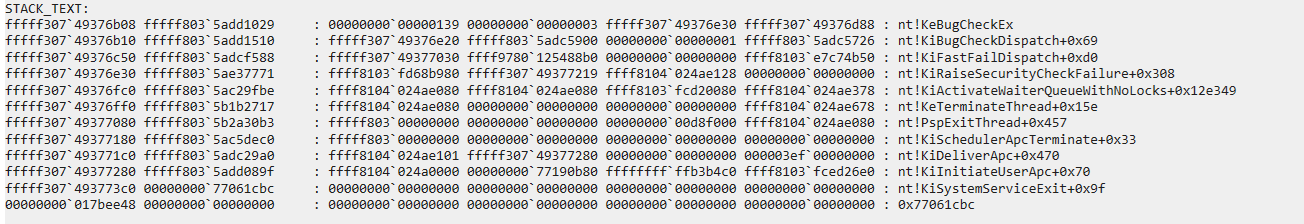
This command will do a full memory analysis and give you verbose results. This is where you can really start your investigating. The top of the output is a banner (Bugcheck Analysis). This is where the base information will be to determine what happened.

The debug file I pulled had a KERNEL_SECURITY_CHECK_FAILURE (139) error. From here you can do some searching for whatever error you see in your dump file (there are endless possible errors). This particular error led me to some Microsoft documentation pointing to a possible software driver issues.

Further down the dump file gives us a PROCESS_NAME: ImageManager.exe. I know software to be my backup process and found the driver to be out of date. Updating the driver resolved my issue.
Conclusion
If it wasn’t for using WinDBG to go through the memory dump file after I had a Blue Screen of Death (BSOD) on one of my servers, this issue could have persisted. Using the Debugger Tool pointed me in the correct direction to getting my server back up and running reliably quicker. Without this, the server would have probably BSOD’d a couple more times before finding the issue.